Introduction
Investing wisely in stocks requires more than following market trends—it demands understanding a company’s financial health. Reading financial statements and key ratios can help investors make informed decisions, reduce risk, and spot profitable opportunities. This guide simplifies the process of analyzing company financials for smarter investing.

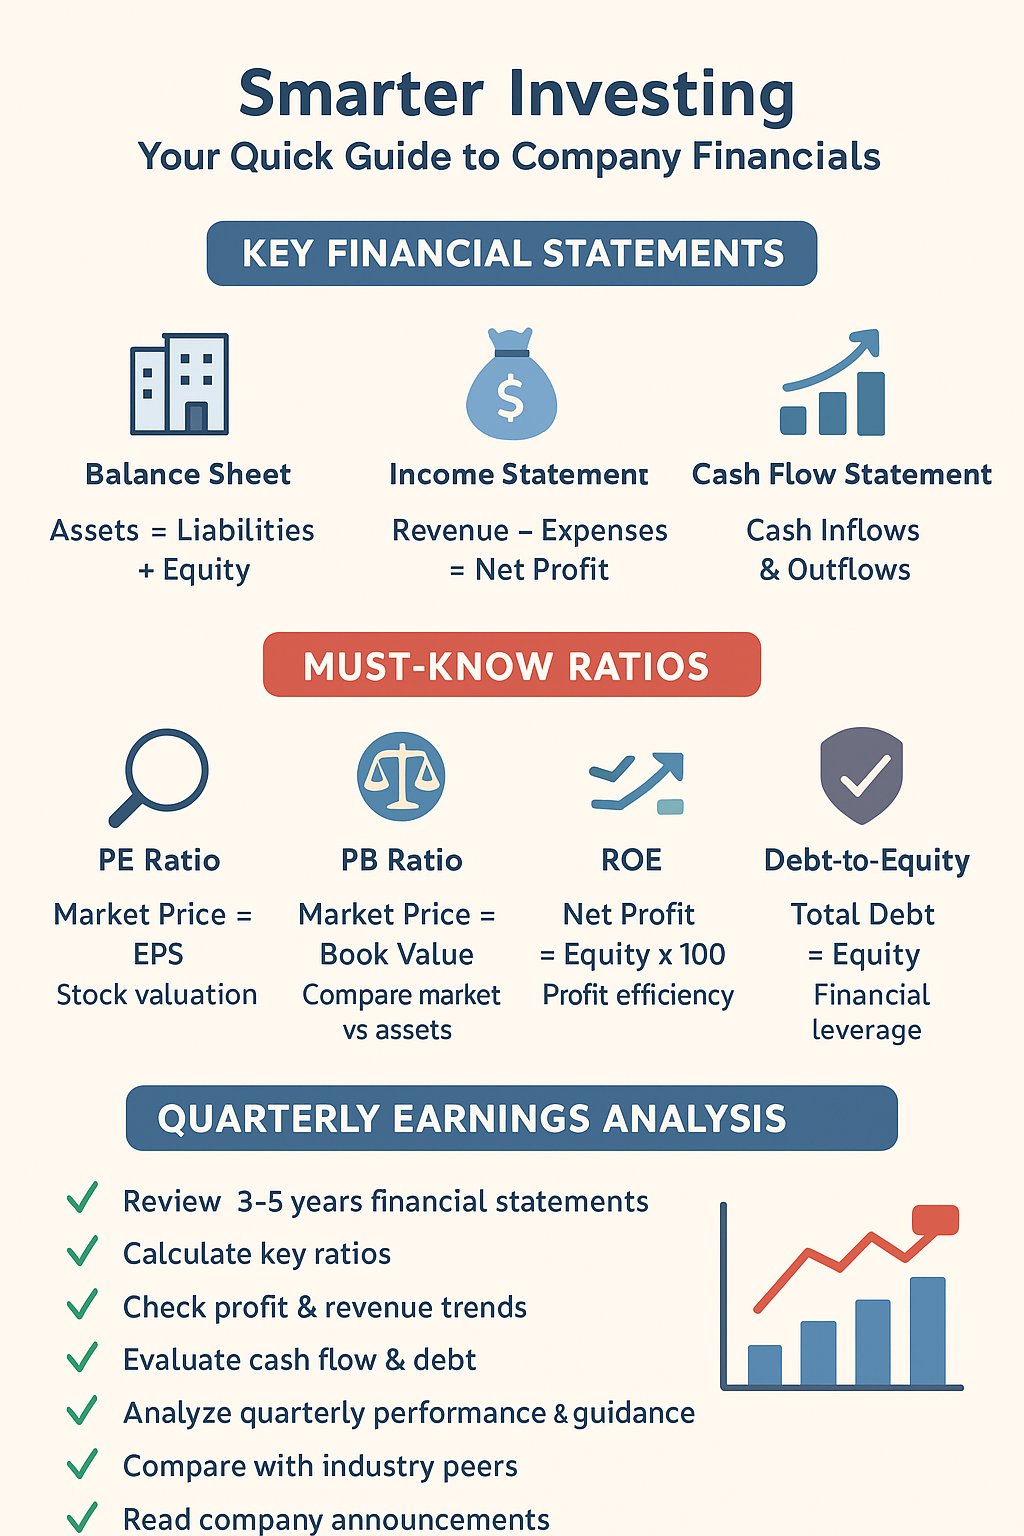
Key Financial Statements
- Balance Sheet
Shows a company’s assets, liabilities, and shareholder equity at a specific point in time.- Assets: What the company owns.
- Liabilities: What the company owes.
- Equity: Shareholders’ stake in the company.
- Income Statement
Reflects a company’s profitability over a period (quarterly or annually).- Revenue: Total money earned from sales.
- Expenses: Costs incurred in running the business.
- Net Profit: Revenue minus expenses; the company’s actual earnings.
- Cash Flow Statement
Shows cash inflows and outflows from operating, investing, and financing activities.- Indicates how well the company generates cash to fund operations or growth.
Key Ratios to Understand
- Price-to-Earnings (PE) Ratio
- Formula: Market Price per Share ÷ Earnings per Share (EPS)
- Indicates how much investors are willing to pay for each rupee of earnings.
- High PE → Stock may be overvalued; Low PE → Could be undervalued.
- Price-to-Book (PB) Ratio
- Formula: Market Price per Share ÷ Book Value per Share
- Compares market valuation to the company’s net assets.
- Return on Equity (ROE)
- Formula: Net Profit ÷ Shareholder Equity × 100
- Measures profitability relative to shareholders’ funds; higher ROE indicates better efficiency.
- Debt-to-Equity Ratio
- Formula: Total Debt ÷ Shareholder Equity
- Evaluates financial leverage; high debt can be risky, especially in downturns.
Analyzing Quarterly Earnings
Quarterly results reveal how a company is performing in the short term. Key points to analyze:
- Revenue Growth: Compare with past quarters to see sales momentum.
- Profit Margins: Net and operating margins show efficiency.
- Earnings Per Share (EPS): Indicates profitability per share.
- Guidance & Outlook: Company projections can affect future stock performance.
- Comparison with Peers: Analyze industry trends and competitors.
Practical Checklist Before Investing
- Review financial statements for 3–5 years.
- Calculate key ratios (PE, PB, ROE, debt-equity).
- Check profit trends and revenue growth consistency.
- Evaluate cash flow health and debt levels.
- Analyze quarterly performance and management guidance.
- Compare with industry peers to understand relative performance.
- Read company announcements for strategic moves or risks.
Conclusion
Understanding financial statements, key ratios, and quarterly results empowers investors to make informed decisions. A structured approach reduces risk, improves returns, and helps identify fundamentally strong companies for long-term investing.
Disclaimer: This article is for educational purposes only and does not constitute financial advice. Investors should consult certified financial advisors before making investment decisions.

